It is a yellow mixture of two carotenoid pigments, lutein and zeaxantin
This is lutein:
What is macular pigment?
It is a yellow mixture of two carotenoid pigments, lutein and zeaxantin
This is lutein:
and this is zeaxanthin:
Note the difference between the two is the position of the
double bond in the six carbon ring at the right, here shown in red.
These carotenoids are derived from plants we eat and they are
concentrated in the eye.
|
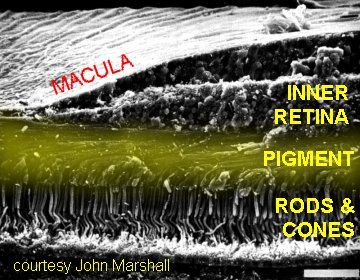
The retina is
the light sensitive layer of cells at the back of the eye. It
has a curious structure with light passing from the front of the eye
and penetrating several layers of retinal nevre cells before it reached
the photosensitive rods and cones. The retina is said to be
"inverted" because of this apparently back to front
arrangement. In the centre of the visual field where the
visual acuity is best (the centre of gaze) the nerve cells overlaying
the cone photoreceptors are displaced to one side making a kind of pit
which is called the macula. This structure give the best
optical resolution without any interference from the other nerve cells.
 |
| The picture on the left is a scanning electron micrograph of a human retina showing the right hand side of the macula. The superficial nerve cells of the inner retina are clearly seen to be displaced. The position of the macular pigment is shown as a yellow haze beneath the inner retina but above the photosensitive portion of the photoreceptors which are the rod shaped sructures. |
What does the pigment do?
It is a free radical scavenger.
Why should we care?
After a life time’s exposure to free radicals,
the photoreceptors (rods and cones) of the retina may decay
prematurely - a condition called AGE RELATED MACULAR DEGENERATION
(ARMD).
Macular pigment may slow this process so the more macular pigment you
have, the better protected your retina may be.
What should I do to increase my macular pigment?
Follow Popeye’s example: EAT YOUR GREENS
 |
Some experts recommend a daily
lutein intake of 6 mg from food although the average intake is probably
a sixth of this. As a guide, the table shows how much lutein
and zeaxanthin (microgram per 100 gram) there is in a half-cup serving
of the vegetable (selected values from an official site
with all kinds of foods listed: http://www.nal.usda.gov/fnic/foodcomp/Data/car98/car_tble.pdf).
The figures vary greatly from sample to sample and are an approximate guide only. The figure quoted is for lutein and zeaxanthin together. The general advice for a diet rich in lutein and zeaxanthin is to eat plenty of dark green vegetables. |
| kale raw | 39550 |
| spinach cooked | 12,600 |
| collard greens coocked | 8000 |
| leaf lettuce raw | 2600 |
| broccoli cooked | 2200 |
| red pepper raw | 2000 |
| peas canned | 1350 |
| brussel sprouts cooked | 1300 |
| okra raw | 390 |
| tomato raw | 130 |
| yellow pepper raw | 120 |
| peaches raw | 57 |
How do I find out how much pigment I have?
Measurement of macular pigment can be done in
vitro or in vivo. In the
former in vitro measurements the eyes are removed
and dissection is followed by microscopic examination or by
spectrophotometry directly on the tissues. Alternatively, the pigment
can be extracted with solvents and chromatography, spectrophotometry or
fluorescence spectrophotometry are used. Of course, none of these
methods is much use to a living individual so in vivo
techniques are employed.
In vivo techniques are all based on the idea that
the macular pigment, because it is yellow, absorbs blue light and this
happens in the macula. Away from the macula, there is no
macular pigment and the blue light is not absorbed (as much).
Several methods have been used over the years and a few are described
here.
Fundus Reflection Densitometry
The top pair of schematics above show blue light and green light being
reflected from the macula: the reflected blue light is attenuated
because it is absorbed by the yellow macular pigment. In the
lower pair, the light is reflected from outside the macula and the
reflected blue light is not attenuated. To obtain an
indication of how much macular pigment is present, all that is
necessary is to collect the reflected light and in some way determine
the ratio of blue to green in the macula and the parafovea.
This has been done in several ways:
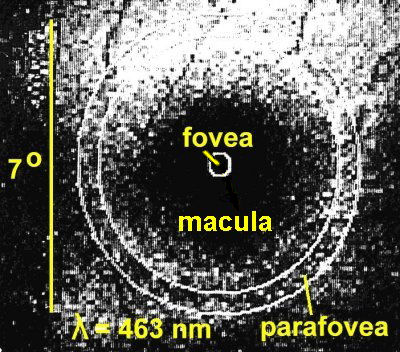
TV Fundus Reflectometry
Kilbride, PE. et al, (Vision Res. 29:663,
1989) used a TV camera with special illumination at 462
nm (blue) and 559 nm (green) wavelengths of light to take pictures of
the fovea. They got a computer to digitise and then subtract
the green picture from the blue picture and thus got an indication of
how much macular pigment was present, and how it was distributed over
the retina. The picture below shows the blue
picture. Even before the green one is subtracted the
darkening in the macula is apparent.
Kilbride's computer produced produced plots of light
absorption as shown below and it is easy to see how
Blue - Green = Pigment
Both the blue and the green light are absorbed in about equal amounts
by haemoglobin and melanin which are present throughout the
retina. Their absorption is cancelled out by this subtraction
process which leaves a plot of just the macular pigment.
Scanning Laser Ophthalmoscopy
The introduction of the scanning laser ophthalmoscope has meant that it
is possible to examine the retina when illuminated by laser light of
closely specified wavelength (colour). This principle has
been used by a number of workers including Tony Halfyard
(Institute of Ophthalmology London, personal communication, 1999) who
have done much the same as Kilbride et al
but with different imaging technology. Halfyard used a
blue-green laser and a red laser but these still can give a good
picture of where the macular pigment is and how much is
present. The figure below shows the subtractive techniques he
used to reveal the pigment and the concentration in the macula is
obvious (by the way, these pictures are of my retina).
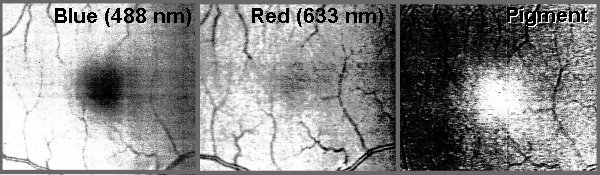
Because he used a blue light of wavelength 488nm which is not at the
peak of the spectral absorption curve of the macular pigment (460nm) it
is necessary to correct the value for the amount of pigment present as
shown below:
The correction factor is about x 1.3 and is easily applied.
Other in vivo Objective Techniques
Other authors have used the SLO, e.g. Berendschot, v d Kraats &
v Norren (Ophthalmic Research, 30/S1,
Ever Meeting Abstracts, Karger, Basel, 1998) who compared
SLO and spectral fundus reflectometry with a subjective method and
found the former the best.
All objective methods are complex and are currently lab-based, often
using mouth bites to position accurately the subject's head for
Maxwellian view - this is where the light that enters the eye is
focused into a small beam to pass through the pupil. The
optical arrangements are complex and expensive, e.g. monochrometers and
xenon lamps.
Delori FC. et al (Invest
Ophthalm Vis Sci. 36:718, 1995)
measured the fluorescence of the melanin in a small spot in the macula
and a few degrees outsdie it. Again subtraction of one set of
data from the other yielded a difference spectrum which is that of
macular pigment. The results are clearly useful, as shown
here for two subjects:
From Delori FC. et
al, Invest Ophthalm Vis Sci. 36:718,
1995
SUBJECTIVE TECHNIQUES
Instead of using objective measurement techniques, many authors have
used subjective techniques where the observer has to make some
judgement about the appearance of a test object. This is
really psychophysics and though such techniques are seldom as accurate
or precise as objective techniques, they are often easier to use and
cheaper to set up. Some of the methods are:
Haidinger’s Polarisation Brushes
Bone RA, et al, Vision Res, 32:105, 1992
An intriguing application of an entoptic "illusion"
Anomaloscope
Moreland JD, et al, Vision Res, 38:3241, 1998
The anomaloscope is used to measure colour vision and here is used to detect and quantify the macular pigment
Heterochromatic Flicker Photometry
Werner JS, Wootten BR. J opt Soc Amer, 69:422, 1979
This is the subjective technique that is now widely used: it is explained below
HETEROCHROMATIC FLICKER PHOTOMETRY
A small test field about one degree across alternates
between blue and green light several times a second. The
colours are chosen, as in the objective techniques, so that
the wavelength of the blue light corresponds with the peak of
absorption of the macular pigment and the wavelength of the green so
that it is not absorbed by the pigment. Usually the
intensity of the green light is fixed but that of the blue is
adjustable by the subject whose task is to reduce the appearance of
flicker to a minimum. When the perceived luminance of the
blue and green lights are different the flicker is very obvious but
when they are the same, the flicker is minimal. The subject
makes two sets of measurements, one with the test field imaged on the
fovea and the other with the test field imaged in the parafovea where
there is very little or no macular pigment. The principle is
shown below:
When minimum flicker is achieved in the two locations, the optical
density of the macular pigment is:
optical
density of MP =log IF - log IP
where IF
is the luminance of the blue light for minimum flicker in the fovea and
IP
is the luminance of the blue light for minimum flicker in the parafovea.
There are some caveats with heterochromatic flicker photometry and this
list is taken from points made by several authors in recent
publications:
There have been many papers describing the use of
heterochromatic flicker photometry (HCFP) to measure macular
pigment. Currently the best known group is working at Harvard
- see Snodderly and Hammond (Chapter 13, In Vivo
Psychophysical Assessment of Nutritional and Environmental Influences
on Human Ocular Tissues: Lens and Macular Pigment, in Nutritional
and Environmetnal Influences on Vision, ed. Allen Taylor,
CRC Press, Boca Baton, 1999) for a good review of the
topic.
Typically, various authors have employed optical laboratory techniques
with arc lamps, monochromators and rotating shutter discs to present
their subjects with the appropriate blue and green flashing
lights. The use of interference filters has helped to
simplify the design of the apparatus, but it has usually been rather
large and expensive. With the suggestion that the onset of
age-related macular degeneration might in some way be linked with the
amount of macular pigment, which is thought to provide protection for
the retina against oxidative stress (it is an antioxidant), it became
important to be able to measure macular pigment in situations other
than research laboratories. A small, portable apparatus was
required that could be taken into any clinic or other location.
At the University of Westminster, we had been using light emitting diodes (LEDs) in investigations of traffic signals and we knew something of their properties. They seemed potential candidates for light sources for a macular pigment measuring instrument (we call such an instrument, rather inaccurately, a maculometer) because as light sources LED’s are:
We were able to select
LED's of appropriate wavelengths which were readily
available. The figure beneath shows how well the radiation
output of the LED's matches the absorption curve of the macular pigment
(shown in grey).
We thought we could make a small portable instrument using
LED's. The first one we made was in a shoe box and we took
the opportunity to redefine the overall concept - we did not want the
subject constrained by a mouth bite, head band or chin rest so we
arranged for the blue adapting background to be viewable around the
blue/green flashing test field without the need for high precision
alignment and imprisonment of the subject. We
did this by projecting a diffused image of an array of suitable LED's
via a sheet of glass at 45 degrees into the space to be occupied by the
subject's eye - see the diagram below. In this way the
subject was free to move their eye in an area about 30 mm across
without changes in the appearance of the adapting field or the test
field. We also wanted a reliable instrument with no moving
parts which are typical of other methods where a rotating shutter or
similar device causes the test field to alternate between blue and
green light. With LED's it is possible to switch
electronically from blue to green, thus avoiding mechanical components
A general view of the prototype (made in a shoe box) with the lid removed and its electronic box is shown below (right). Also shown (left) is the subject's view of the adapting field and the test field (lid removed).
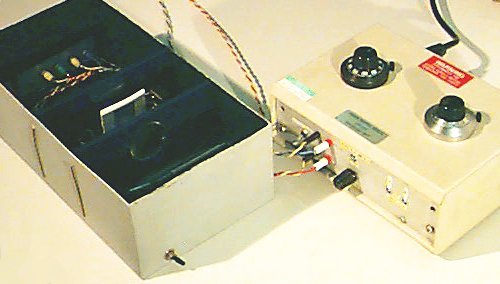 |
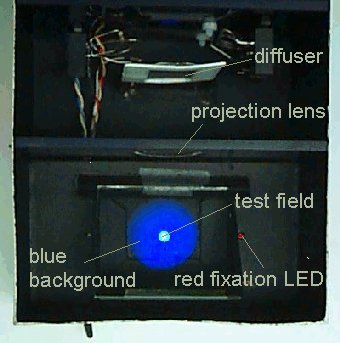 |
The red fixation LED is provided to make the minimum flicker matches on the parafovea: for the foveal matches, the subject looks straight at the test field. To make the instrument yield reliable measurements, we had to tailor the properties of the electronic drive circuitry to the psychophysical behaviour of a typical subject. This instrument was described at the European Association for Vision and Eye Research (EVER) meeting in Palma de Mallorca, October 1998 (Ophthalmic Research, 30/S1, Ever Meeting Abstracts, Karger, Basel, 1998).
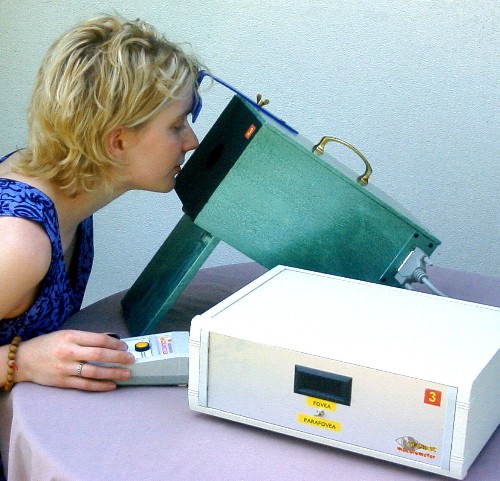
The prototype was a success but it was considered fragile (the lens, glass plate, etc.) and expensive (lens). Consequently the instrument was re-designed. It went through a number of versions but at the EVER meeting in October 1999 (Ophthalmic Research, 31/S1, Ever Meeting Abstracts, Karger, Basel, 1999), again in Palma de Mallorca, we described the current instrument which dispenses with any optical components - no lens, no glass. The three parts of the instrument are shown below - the subject views the test field and background through the aperture in the Optical Unit (left of picture) resting their forehead against the blue guide bar, adjusts the control on the Subject's Unit for a minimum flicker match and the operator reads of the setting from the meter on the Operator's Unit (picture right).
 |
 |
| On the left is shown the eyemet Maculometer which is currently being used in clinics in Europe on a range of trials |
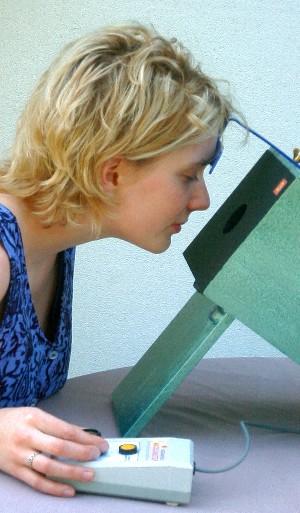
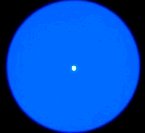
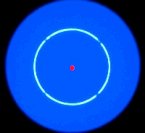
The need to change fixation to measure the parafoveal matches is eliminated by using an annular test field, as shown below (left). The central foveal test field is illuminated only by a dim red LED to provide a fixation point for the subjects whilst they make the parafoveal matches with the annular field alternating blue and green To make matches in the fovea, the annulus and the red fixation LED are turned off and the foveal test field flickers blue and green. The two photographs (below right) show the subject's view of the foveal test field (upper) and the parafoveal test field and red fixation spot (lower). The test fields are set to work at high luminances, around 150 cd.m-2, so the measurements can be carried out successfully in rooms that are not very dim. The picture below (centre) shows a subject making a match.
 |
 |
 |
 |
Six instruments have been used in several supplementation trials and in a number of European countries and in Australia: it has proved to be a versatile and reliable screening instrument.
For an evaluation,
see:
LOANE,
E., STACK, J., BEATTY, S. & NOLAN, J.M. Measurement of
Macular Pigment Optical Density Using Two Different Heterochromatic
Flicker Photometers Current
Eye Research, 32:555–564,
2007
Return to the John Mellerio Home Page
Contact email: